In today’s post we will discuss how to use expected move in options trading. One of the main concerns new traders have about trading options is how far the price of the underlying can move after they put on a trade. No one wants to get trapped in a trade and not know what to do about it. Knowing how to use the expected move of a stock price before entering a trade can go along way to affording the peace of mind you need to place a trade in the first place.
What is expected move
The expected move of the underlying stock is the estimated dollar move of the underlying price for any given expiration date with a 68% certainty. When you think about this is a powerful statement. If the expected move has a 68 % probability of remaining within its expected move, then placing your strikes at, or just outside that range can lead to a winning trade 68% of the time.
You may recognize this 68% range as 1 standard deviation from the current price. Statistically speaking a 2 standard deviation move occurs 95% of the time, and a 3 standard deviation move occurs 99.7% of the time.
In other words 7 out of 10 trades can have a positive outcome. Those are pretty good odds, especially so when you consider that stock trading is a 50/50 bet. Granted nothing can be right every time.
If you are looking to have greater certainty about the movement of the underlying before you enter a trade, then placing your strikes wider than the expected move can give you a high probability trade all things being equal.
I don’t mean to minimize the possibility of outlier moves. Options trading is about probabilities not about absolute certainty. No one can give you that.
How to calculate the Expected move
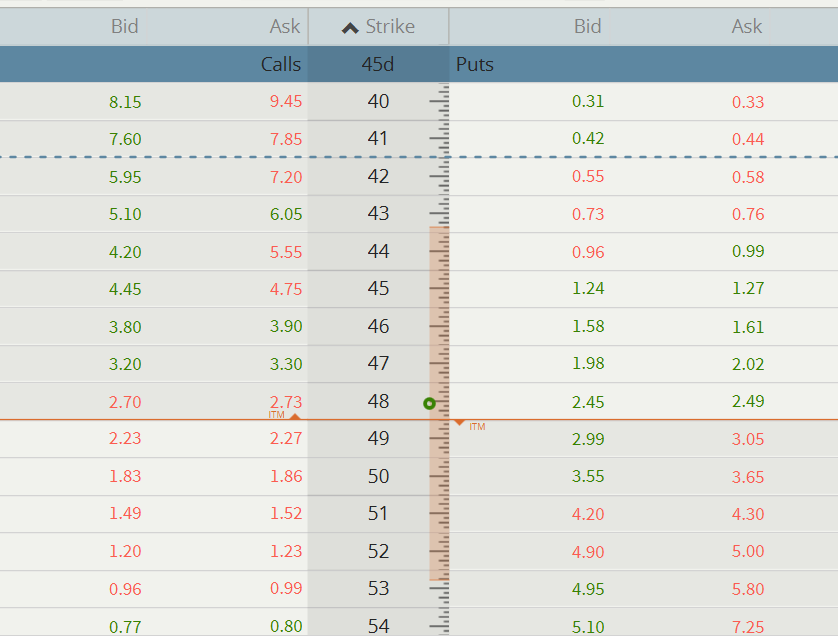
The two main ways to calculate the expected move are much easier than you may think. One way is to make use of the tools available on your trading platform. The broker I use (tastytrade) has a built bar line that shows you where the expected move is for any expiration. No need to get into long calculations and formulae. Its right there in front of you as soon as you open up an options chain. (see below).
Another method is to add the price of the at the money (ATM) call and the ATM put and multiply that sum by 86%. This will give you a fair approximation of the expected move.
How to use Expected move to choose your Options strike prices
Let’s say you want to trade a stock that you believe will stay within a certain range over the next 45 days. You want to define your risk to keep within the limitations of you account and you have chosen to use an Iron Condor to define that risk. So you ask where should I place my strikes?
Here is a screenshot of the expected move (vertical red bar) from my tastytrade platform. This option chain is for Intel (INTC) 45 days to expiration.

The platform shows an expected move of around $5.00 above and below the current ATM price of $48. The top of the bar is 43, and the bottom is 53. If you’d like to confirm this number add the ATM call (2.73) and ATM put (2.45) and multiply by .85. e.g.2.73 + 2.49 = 5.22 x .85 = 4.85. Very close to a $5.00 expected move up or down.
Next you will see that the expected range for the 45 DTE expiration is from 43.5 – 53.5 or +/- 4.4. By placing the shorts strikes of your Iron condor at or close to those strikes, you are putting your trade in a position of having an approximately 68% probability of being right. Since the Iron Condor is a defined risk strategy, you would also need to add a long put and a long call to define that risk. A 38 long put and the 58 long call may be an appropriate strike for this strategy. Ideally you would want to collect 1/3 the width of the strike as a credit for this strategy, or approximately $1.65 for $5 wide spreads.
The max loss would be $3.35 ($335.00). (Spread width ($5) – credit received ($1.65) = Max loss.
In this scenario you are setting up a trade with a 68% probability of success and a defined max loss of $335.00.
In theory we would expect prices to fall within the range 68% of the time. In a large scale backtest at tastytrade research they found that stocks in the S&P 500 (SPY) tended to fall within the expected range at a much greater probability than the expected 68%. The range in this backtest was closer to 79%.
Instead of shooting in the dark to find the right strikes, you can use expected move to get you off in a reasoned, and probablistic way. You know the expected move when you start and you have defined your risk if it doesn’t play out as you expected.. That’s a good combination by any stretch.
Conclusion
Whether you are trading defined or undefined strategies knowing the expected price move in the underlying can offer a window of opportunity into setting up high probbilitty trades. Do some experimenting with various strikes on your trading platform and paper trade for awhile. Keep notes and see how this plays out over a period of time. You’ll be amazed at the power of using expected move.
Remember that Expected Move is an estimation based on historical data and market conditions. It is not a guarantee of future price movement. Therefore, it’s important to conduct thorough research, stay updated with market news, and use Expected Move as a tool alongside other analysis techniques.
Please leave your comments, questions, and suggestions below
Happy Trading!!!!


